Die Geschirrspüler-Demo
Dieses Notebook gibt einen verständlichen Überblick über die ergonomische Analyse beim Ausräumen eines Geschirrspülers. Dabei werden Sensordaten genutzt, um Beugephasen zu erkennen und die Haltungsqualität zu bewerten. Die hier verwendeten Daten stammen von einer Person, die einen Geschirrspüler eine Minute lang bei einer Messfrequenz von 25 Hz ausräumt.
Die Datenanalyse umfasst:
- Laden und Verarbeiten von Zeitreihendaten für Körperwinkel und Bewegung.
- Erkennen von Aktionen mit Vorbeugung.
- Bewerten der Haltungsqualität während jeder Beugephase anhand von Lendenwinkel und Oberkörpertorsion.
# flexlib is a python library written by MinkTec to facilitate easy FlexTail data processing
import flexlib
from flexlib import MeasurementEvaluationMetric as mem
from flexlib import CountingPredicateSchmittTrigger, SchmittState

import seaborn as sns # plotting
import matplotlib.pyplot as plt # plotting
import pandas as pd # dataframes / tables
import numpy as np # math
Nach dem Importieren der Bibliotheken können wir die mit dem FlexTail-Sensor aufgezeichneten Daten laden. Die Methode create_dataframe übernimmt die Rohwerte und berechnet aus den Sensordaten abgeleitete Kennzahlen. So lassen sich die Sensordaten einfach weiterverarbeiten. Für komplexere Auswertungen können auch Sensorwinkel oder Koordinaten berechnet werden.
measurements : flexlib.AnnotatedRecording = flexlib.FlexReader().parse("./test_data/dishwasher.rsf")
df : pd.DataFrame = flexlib.create_dataframe(measurements)
df| Zeit | lumbarAngle | twist | lateral | sagital | thoracicAngle | acceleration | gyro | |
|---|---|---|---|---|---|---|---|---|
| 0 | 2024-12-10 08:30:19.051 | -0.302 | -0.033 | 0.021 | -0.080 | 0.310 | 0.983 | 1.660 |
| 1 | 2024-12-10 08:30:19.118 | -0.306 | -0.018 | 0.005 | -0.078 | 0.306 | 1.002 | 1.360 |
| 2 | 2024-12-10 08:30:19.169 | -0.305 | -0.022 | 0.012 | -0.069 | 0.308 | 0.983 | 1.160 |
| … | … | … | … | … | … | … | … | … |
| 1484 | 2024-12-10 08:31:19.888 | 0.124 | 0.087 | 0.341 | 0.853 | 0.471 | 0.841 | 2.060 |
1485 Zeilen × 8 Spalten
Lendenwinkel:
Der Lendenwinkel wird aus Sensordaten berechnet, die am unteren Rücken erfasst werden. Er beschreibt Flexion oder Extension der Lendenwirbelsäule und quantifiziert, wie stark sich der untere Rücken während einer Bewegung nach vorn oder hinten beugt.
Sagittalwinkel
Der Sagittalwinkel beschreibt die Vor- oder Rückneigung des Rumpfs in der Sagittalebene. Er wird aus der Sensorform und der Gehäuseposition abgeleitet.
Beide Werte werden im Bogenmaß angegeben; ein positiver Wert bedeutet Vorbeugung.
plt.figure(figsize=(12, 6))
plt.plot(df['Time'], df['lumbarAngle'], label='Lumbar Angle')
plt.plot(df['Time'], df['sagital'], label='Sagittal')
plt.xlabel('Time')
plt.ylabel('Angle (radians)')
plt.title('Lumbar Angle and Sagittal Over Time')
plt.legend()
plt.tight_layout()
plt.show()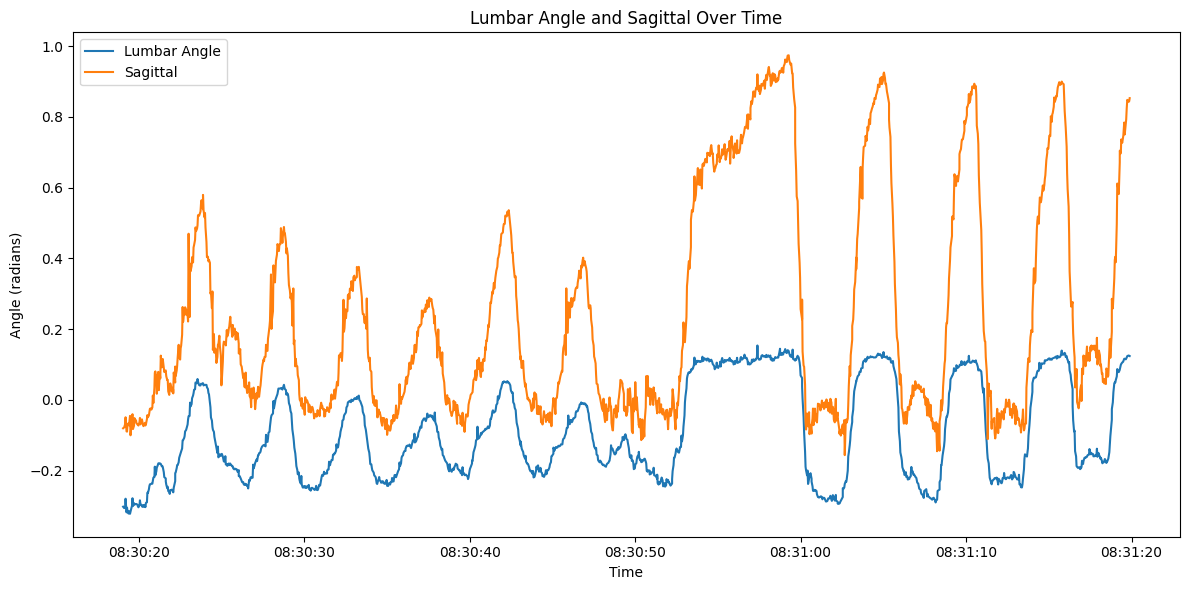
Schmitt-Trigger zur Beugeerkennung
Als Nächstes wollen wir erkennen, wann sich die Person nach vorn beugt. Dafür verwenden wir einen Schmitt-Trigger. Er hilft dabei, durch die Person verursachtes Rauschen oder Zittern effizient herauszufiltern. Würden wir jede Messung mit einem Sagittalwinkel über 30 Grad als Beugung zählen, könnten sehr kurze oder undefinierte Kanten in den erkannten Zeitstempeln entstehen. Der Schmitt-Trigger ermöglicht einen Auslöseschwellenwert (hoch), hier 30 Grad, und einen Rücksetzschwellenwert (niedrig), zum Beispiel 25 Grad.
Hier verwenden wir einen CountingSchmittTrigger, der seinen Zustand erst ändert, wenn die festgelegten Schwellenwerte über eine bestimmte Anzahl von Messungen erfüllt sind.
# Define thresholds and counts for the Schmitt trigger
sagital_high = 0.15
sagital_low = 0.05
high_count = 3  # Number of consecutive points above high to trigger
low_count = 3   # Number of consecutive points below low to reset

# Define predicates for the sagital signal
high_predicate = lambda x: x > sagital_high
low_predicate = lambda x: x < sagital_low

# Create the CountingPredicateSchmittTrigger
trigger = CountingPredicateSchmittTrigger(
    high_predicate=high_predicate,
    low_predicate=low_predicate,
    high_count=high_count,
    low_count=low_count
)

# Track the trigger state for each time point
bending_mask = []
for val in df['sagital']:
    trigger.add(val)
    bending_mask.append(trigger.state == SchmittState.HIGH)

df['bending'] = bending_mask

plt.figure(figsize=(12, 6))
plt.plot(df['Time'], df['lumbarAngle'], label='Lumbar Angle')
plt.plot(df['Time'], df['sagital'], label='Sagittal')
plt.fill_between(df['Time'], df['lumbarAngle'].min(), df['sagital'].max(), where=df['bending'], color='orange', alpha=0.2, label='Bending Forward')
plt.xlabel('Time')
plt.ylabel('Sagittal Angle (radians)')
plt.title('Sagittal Angle with Bending Forward Periods')
plt.legend(loc='upper left')
plt.tight_layout()
plt.show()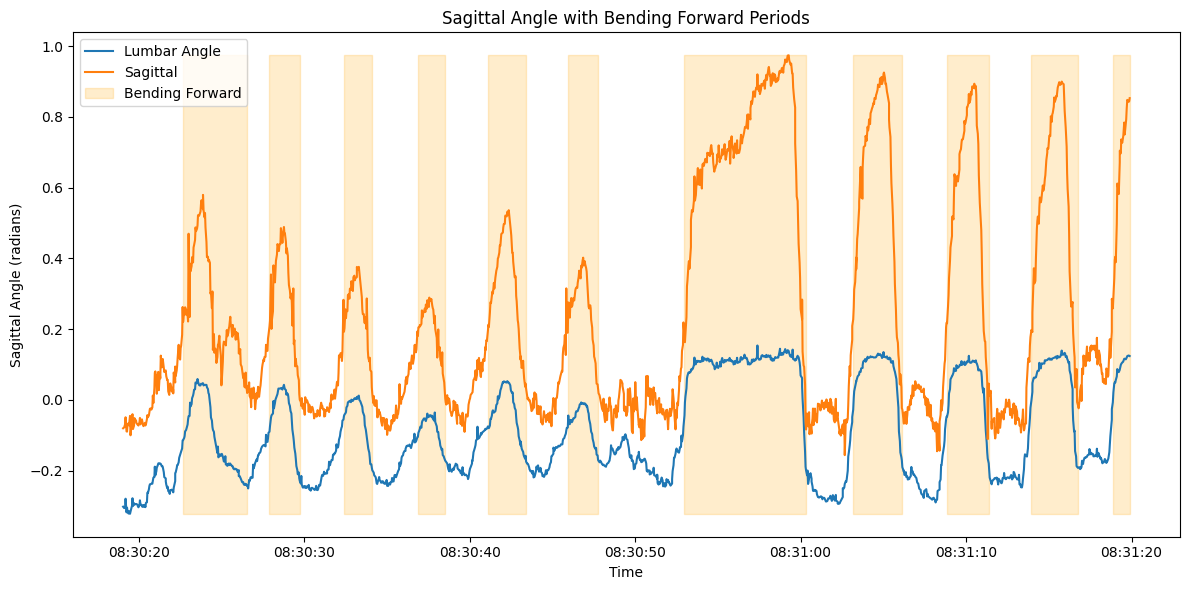
Gut. Die als Vorbeugung markierten Abschnitte entsprechen unserer Erwartung und sind klar voneinander getrennt. Hier steht ein Block „Bending Forward” für das Herausnehmen einer Tasse oder eines Tellers aus dem Geschirrspüler.
Als Nächstes möchten wir die ergonomische Qualität der Bewegungen einfach bewerten. Dazu kombinieren wir die Beugung der Lendenwirbelsäule mit der Oberkörpertorsion twist. Die Bewegungen werden von 0 (schlecht) bis 1 (gut) bewertet.
lumbar = df['lumbarAngle']
twist = df['twist']

# Score: 1 is perfect, 0 is bad; penalize more when both are bad
# This score is kind of arbitrary and can be adjusted based on the specific requirements
lumbar_norm = (lumbar / 0.3).clip(0, 1)
twist_norm = (twist.abs() / 0.15).clip(0, 1)
df['score'] = 1 - (lumbar_norm + twist_norm) / 3 - (lumbar_norm * twist_norm)

# Find contiguous bending forward periods using pandas magic
bending_periods = [group.index.tolist() for _, group in df[df['bending']].groupby((~df['bending']).cumsum())]

# Compute average score for each bending period (simple version)
period_scores = []
for i, period in enumerate(bending_periods):
    avg = df['score'].loc[period].mean()
    period_scores.append({'period': str(i+1), 'score': avg})

period_scores_df = pd.DataFrame(period_scores)

plt.figure(figsize=(10, 5))
plt.bar(period_scores_df['period'], period_scores_df['score'])
plt.xlabel('Bending Forward Period')
plt.ylabel('Average Score')
plt.title('Bending Forward Quality per Period')
plt.ylim(-0.05, 1.05)

x_pos = 5.5
plt.axvline(x=x_pos)
plt.text(x_pos+0.05, 0.95, 'Start emptying bottom drawer', rotation=90, va='top', fontsize=11, fontweight='bold')

plt.tight_layout()
plt.show()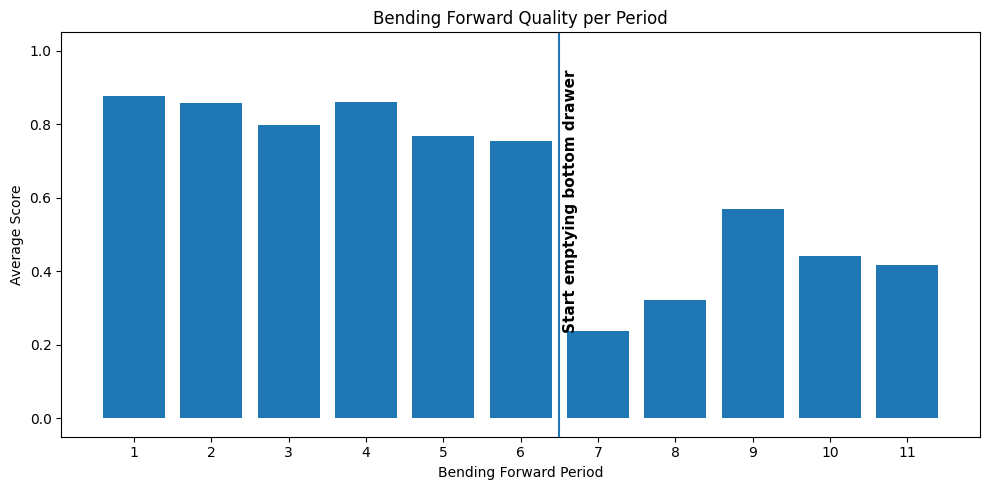
Unsere einfache Bewertung zeigt deutlich: Sobald die Person beginnt, den unteren Korb des Geschirrspülers auszuräumen, nimmt die ergonomische Qualität ab.
Zusammenfassung
Wir haben:
- Sensordaten geladen.
- Ein Diagramm erstellt.
- Vorbeugephasen erkannt.
- Die ergonomische Belastung bewertet.
Und all das mit 88 Zeilen Code, einschließlich Kommentaren, Imports und Diagrammen.